
We've Been Here Before. Here's the Chart That Proves It.
July felt chaotic. And in many ways, it was.
A hedge fund called Situational Awareness, run by a former OpenAI employee, imploded. Its portfolio of AI stocks, which had peaked at more than $40 billion, was forced into a fire sale to Citadel. The AI names it owned reversed violently. The Morgan Stanley Momentum index was down 38% from its June high at one point — the kind of move that puts you in the same company as 2008 and the dot-com crash.
Ugly. No question.
But I've seen this movie before. And so have you.
The Chart Worth a Thousand Words
The latest Bespoke Investment Group report includes one chart that stopped me in my tracks. It overlays the Nasdaq's performance after the Netscape browser launch in December 1994 against its performance after ChatGPT launched in November 2022.
Through 918 trading days, roughly where we sit today, the two lines track each other with eerie precision. Netscape era: +151%. ChatGPT era: +128%.
Here's where it gets interesting.
In the summer of 1998 — almost exactly the same point in the Netscape cycle that we're at now — a hedge fund called Long-Term Capital Management blew up. Massively leveraged, genius-run, and catastrophically wrong. The Fed had to step in. Markets were rattled.
Sound familiar?
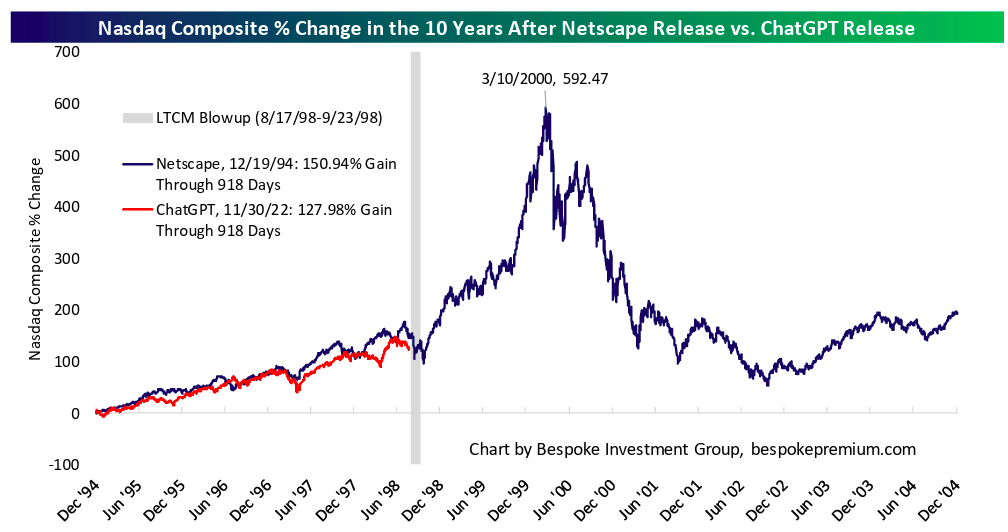
After LTCM, the Nasdaq didn't collapse. It wobbled, about 30% peak to trough, then went on to become one of the greatest bull runs in market history. The current Nasdaq drawdown from its June high? Just under 10%.
What This Means — and What It Doesn't
History doesn't guarantee anything. If you follow the Netscape chart all the way out, the story eventually ends badly. The dot-com bust was brutal.
But it does tell us that volatility, dramatic blowups, and panicked headlines are a normal part of how major technological transitions play out. The question isn't whether things will be bumpy, they will. The question is whether you're positioned to stay the course.
A couple of other things worth noting: the equal-weight S&P 500 hit a new all-time high this week, even as the headline index treaded water. Broader participation is healthier than a market held up by five stocks. And earnings have been strong, 78% of companies beat EPS estimates this quarter, with 74% topping sales forecasts.
The underlying economy isn't flashing red. It just hit a speed bump.
The Bottom Line
The AI story is real. The earnings growth is real. And the adoption curve is still in its early stages.
In 1998, it felt like the wheels were coming off. They weren't. August and September will likely stay bumpy — they always do. But the structural case hasn't changed.
Stay diversified. Stay patient. And take the long view.
Ready to grow your wealth?
Let's talk. One call. No risk. Just a way to see if we're a good fit.